Projects
The tappAS application is project based: you create a project, input your data, and work with it. Each project has a corresponding file folder where all its data and analyses results are stored. All the necessary project management functions – create, open, rename, and delete – are provided in the application. To create a project, you must provide the following information:
- A unique project name
- The biological species associated with the RNA-seq data
- The file location for the annotation features file or select one of the application provided annotation files
- The experiment type
- The file location for your experiment design file
- The file location for your transcript level raw counts expression matrix file
- Optionally, but recommended, the low count and coefficient of variation filtering parameter
- Optionally, the inclusion or exclusion transcripts list file location for filtering
Input Data and Filtering
There are three input data files required to create a project: an experiment design file, a transcript level raw counts expression matrix, and a corresponding annotation file. The input data and optional filtering block diagram is shown below:
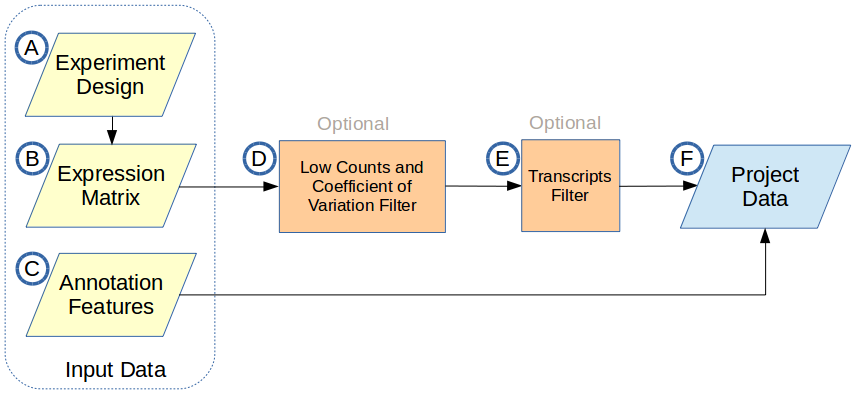
A. Experiment Design
B. Expression Matrix
C. Annotation Features
A data file containing annotation features for all expressed transcripts. Any transcript in the expression matrix that is not included in this file will be filtered out. You may use one of the annotation files provided by the application or use your own. The application currently provides the following annotation files:
- Homo sapiens – Ensembl and RefSeq
- Mus musculus – Ensembl and RefSeq
- Arabidopsis thaliana – Ensembl
- Zea mays – Ensembl
See Annotation Features File Format for details.
D. Low Counts and Coefficient of Variation Filter
E. Transcripts Filter
F. Project Data
Expression Matrix Data Normalization
As previously stated, the application keeps a copy of the original raw counts expression matrix and also creates a new matrix using normalized counts. The Trim Mean of M (TMM) normalization procedure by Robinson and Oshlack, provided in the R package NOISeq, is used to normalize the data.
You may view the NOISeq documentation and installation instructions at:
Experiment Design File Format
The experiment design file defines the relationship between the expression matrix data and the various experimental groups, time slots, and replicates. There are three experiment types supported by the application:
- Case-Control
- Time-Course Single Series
- Time-Course Multiple Series
The design file will change depending on the experiment type. However, regardless of experiment type, it is possible to use the same expression matrix and just modify the design file. By doing so, you have the option to run case-control analysis, and time-course single series analysis using the data from a time-course multiple series experiment. You may also, leave out replicates, time slots, etc. without having to make any changes to the expression matrix.
Regardless of what data you use from the expression matrix, the first experimental group is treated as the control group where relevant. The following format rules apply to all design files:
- The data must be in Tab Separated Values (TSV) format and must contain a single line header
- Comment lines are not allowed
- The first experimental group is considered the control group where relevant
- All samples for an experimental group must be grouped together
- All samples for a given time slot, within an experimental group, must be grouped together
- All time slots for a given group must be specified in chronological order
- Time values must be specified using numbers only – no time units
- Sample column names must be unique
- Sample column names are case-sensitive and must match the expression matrix
Case-Control Design File
The case-control design file must contain two experimental groups. Each group must contain at least two replicates.
Sample design file:
| sample | group |
|---|---|
| CASE1 | CASE |
| CASE2 | CASE |
| CONTROL1 | CONTROL |
| CONTROL2 | CONTROL |
Single Series Time-Course Design File
The single series time-course design file must contain a single experimental group. The group must contain at least two time slots with a minimum of two replicates per time slot.
Sample design file:
| sample | time | group |
|---|---|---|
| CASE1 | 0 | CASE |
| CASE2 | 0 | CASE |
| CASE3 | 3 | CASE |
| CASE4 | 3 | CASE |
Multiple Series Time-Course Design File
The multiple series time-course design file must contain at least two experimental groups. Each group must contain at least two time slots with a minimum of two replicates per time slot.
Sample design file:
| sample | time | group |
|---|---|---|
| CASE1 | 0 | CASE |
| CASE2 | 0 | CASE |
| CASE3 | 3 | CASE |
| CASE4 | 3 | CASE |
| CONTROL1 | 0 | CONTROL |
| CONTROL2 | 0 | CONTROL |
| CONTROL3 | 3 | CONTROL |
| CONTROL4 | 3 | CONTROL |
Expression Matrix File Format
The expression matrix file must contain raw expression counts for one or more experimental groups. Each group may have one or more time slots with each time slot having at least two replicates. The following format rules apply:
- The data must be in Tab Separated Values (TSV) format and must contain a single line header
- A unique transcript id identifies each row and must match one of the transcripts provided in the annotation file or it will be discarded
- Sample column names must be unique
- Sample column names are case-sensitive and must match the experiment design file
- The columns do not need to be in any specific order – the experiment design file will provide grouping information
Expression matrix file partial contents sample:
| NPC1 | NPC2 | OLD1 | OLD2 | |
|---|---|---|---|---|
| Transcript.1 | 7275 | 3602 | 3707 | 3485 |
| Transcript.2 | 358.64 | 206.58 | 2056.72 | 2094.65 |
| Transcript.2 | 332.44 | 329.38 | 1529.46 | 1318.57 |
| Transcript.4 | 46.92 | 13.03 | 20.82 | 33.78 |
Annotation Features File Format
The annotation file must follow the basic Generic Feature Format 3 (GFF3). However, it has been slightly modified to suit the application: the “score” and “phase” columns are not used and some of the attributes may not fully abide by the formal specifications. The file consists of a set of annotation features for each transcript. Each set of features is divided into sections as follows:
Transcript Level Feature Annotations – basic transcript information, UTR motifs, microRNAs, etc.
Genomic Level Feature Annotations – exons, splice junctions, etc.
Protein Level Feature Annotations – gene ontology features, domains, phosphorylation sites, etc.
Transcript 2
…
Transcript 3
…
Some of the annotation features must be named as expected by the application, see sample annotation file below:
| Source | Feature | Description |
|---|---|---|
| tappAS | transcript | Start of transcript features |
| tappAS | gene | Gene information |
| tappAS | CDS | CDS information |
| tappAS | genomic | Start of genomic features |
| tappAS | exon | Exon |
| tappAS | splice_junction | Splice junction |
| tappAS | protein | Start of protein features |
In addition, the following attributes must be named as required by the application, see sample annotation file below:
| Attribute | Description |
|---|---|
| ID | Feature ID |
| Name | Feature name |
| Desc | Feature description |
| Chr | Feature chromosome |
Annotation file partial contents sample (header should not be included):
| SeqName | Source | Feature | Start | End | Score | Strand | Phase | Attributes |
|---|---|---|---|---|---|---|---|---|
| PB.3189.4 | tappAS | transcript | 1 | 1399 | . | + | . | ID=XM_006524897.1; primary_class=full_splice_match; PosType=T |
| PB.3189.4 | tappAS | gene | 1 | 1399 | . | + | . | ID=Qpct; Name=Qpct; Desc=glutaminyl-peptide cyclotransferase (glutaminyl cyclase); PosType=T |
| PB.3189.4 | tappAS | CDS | 10 | 951 | . | + | . | ID=XP_006524960.1; PosType=T |
| PB.3189.4 | UTRsite | 3’UTRmotif | 1288 | 1295 | . | + | . | ID=U0023; Name=K-BOX; Desc=K-Box; PosType=T |
| PB.3189.4 | UTRsite | PAS | 1380 | 1399 | . | + | . | ID=U0043; Name=PAS; Desc=Polyadenylation Signal; PosType=T |
| PB.3189.4 | mirWalk | miRNA | 986 | 993 | . | + | . | ID=mmu-miR-495-5p; Name=mmu-miR-495-5p; Desc=UTR3; PosType=T |
| PB.3189.4 | tappAS | genomic | 1 | 1 | . | + | . | Chr=chr17; PosType=G |
| PB.3189.4 | tappAS | exon | 79052257 | 79052388 | . | + | . | Chr=chr17; PosType=G |
| PB.3189.4 | tappAS | exon | 79070673 | 79070951 | . | + | . | Chr=chr17; PosType=G |
| PB.3189.4 | tappAS | exon | 79077482 | 79077658 | . | + | . | Chr=chr17; PosType=G |
| PB.3189.4 | tappAS | exon | 79079467 | 79079566 | . | + | . | Chr=chr17; PosType=G |
| PB.3189.4 | tappAS | exon | 79081747 | 79081863 | . | + | . | Chr=chr17; PosType=G |
| PB.3189.4 | tappAS | exon | 79089623 | 79090216 | . | + | . | Chr=chr17; PosType=G |
| PB.3189.4 | tappAS | splice_junction | 79052388 | 79070673 | . | + | . | ID=known_canonical; Chr=chr17; PosType=G |
| PB.3189.4 | tappAS | splice_junction | 79070951 | 79077482 | . | + | . | ID=known_canonical; Chr=chr17; PosType=G |
| PB.3189.4 | tappAS | splice_junction | 79077658 | 79079467 | . | + | . | ID=known_canonical; Chr=chr1; PosType=G |
| … | … | … | … | … | … | … | … | … |
| PB.3189.4 | tappAS | protein | 1 | 313 | . | + | . | ID=NP_001303658.1; PosType=P |
Generating an annotation file is not a trivial task and it’s not recommended unless you have a good programming background and knowledge of annotation features. If possible, use one of the annotation files provided by the application. If no annotation file is provided for the species you are interested in, you may contact us .