Application Interface
tappAS is a Java application and its Graphical User Interface (GUI) is based on JavaFX. Using JavaFX allows the application to work across multiple Operating Systems (OS) and provide the same look and feel of native applications. In addition, JavaFX allows the application to provide the rich set of features expected from a modern GUI application.
GUI Layout
The application layout consists of 3 main sections: a top tool bar and two tab panels, a data tab panel on top and a data visualization tab panel on the bottom, see image below.
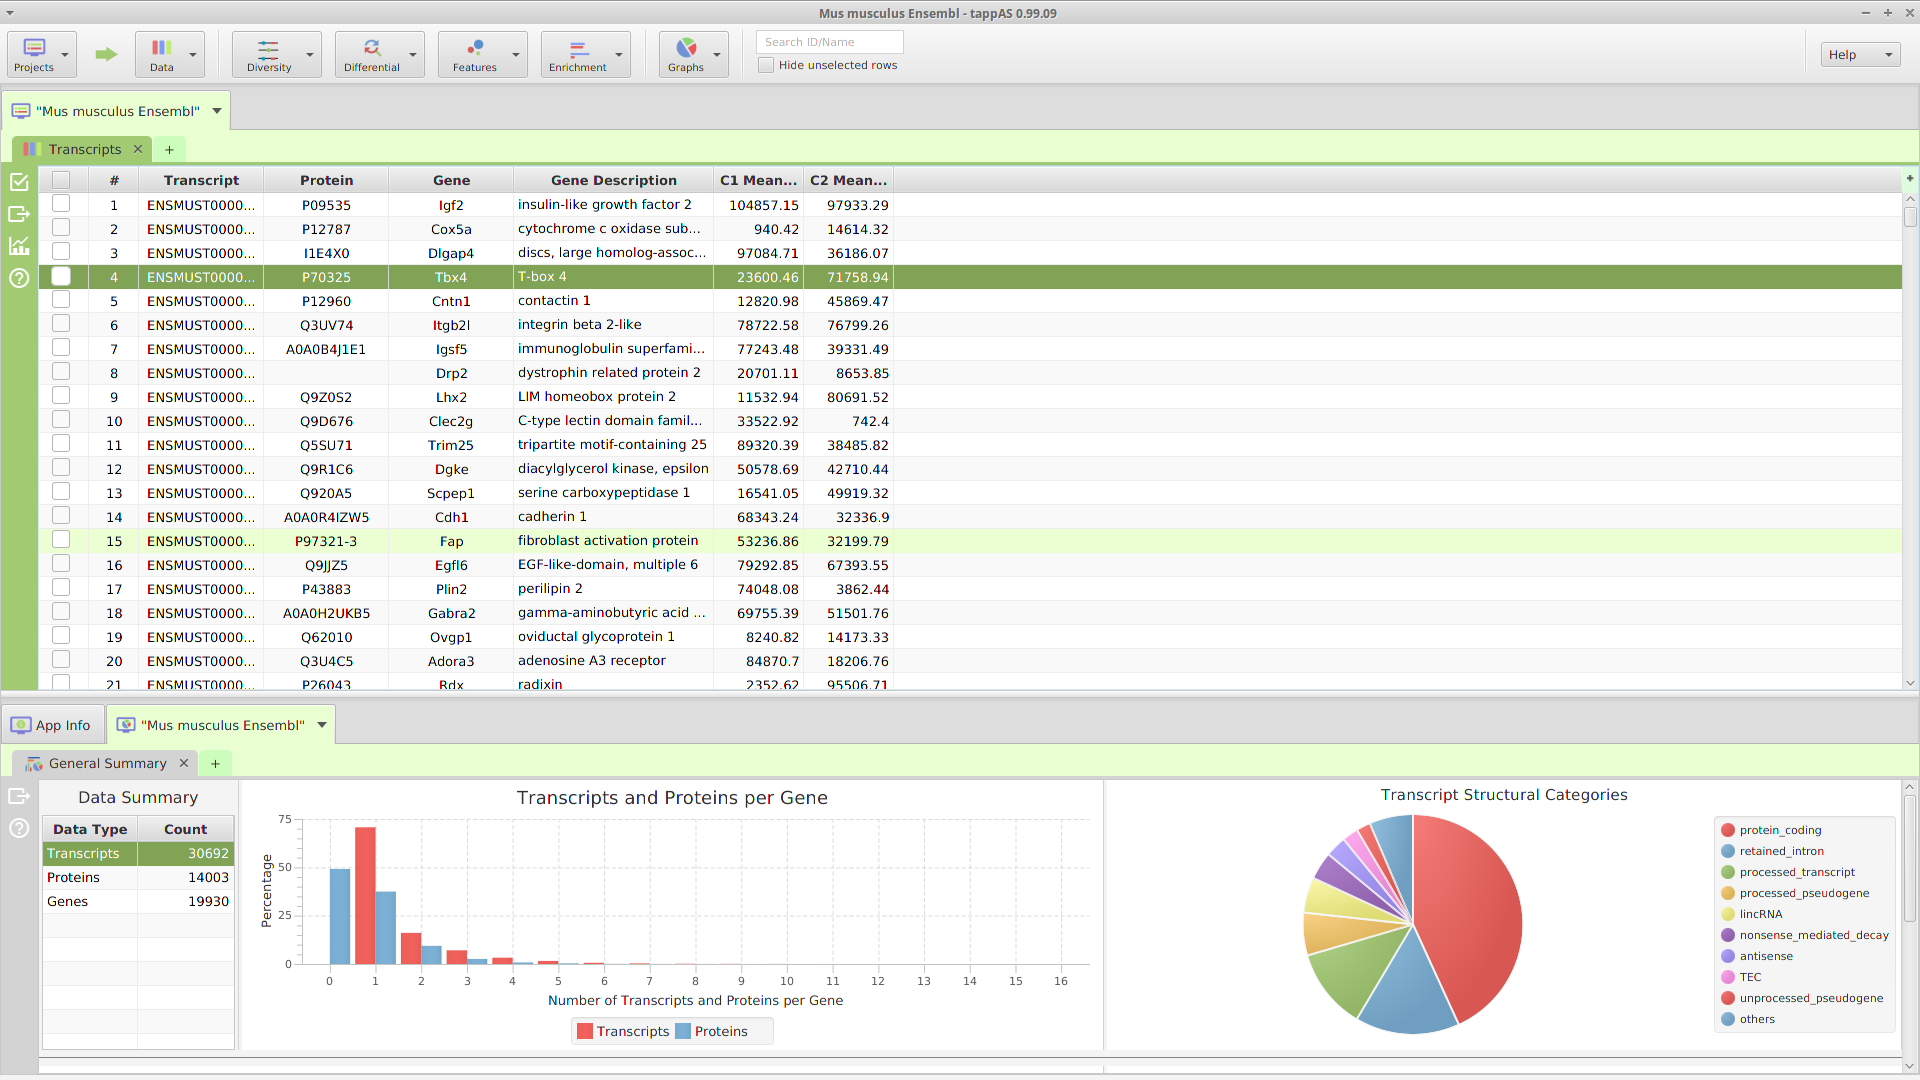
Application GUI Layout
A. Top Tool Bar
The top tool bar provides access to all the high level functionality in the application. Starting on the left, it contains multiple menu buttons:
- Projects – provides access to all the project management functions: create, open, close, list, and delete
- Data – provides access to all the project data: transcripts, proteins, genes, and original expression matrix. In addition, it provides a menu selection to reinput the project data
- Diversity – provides access to all the annotation features diversity management functions: run analysis, view and clear analysis results
- Differential – contains all the differential expression and splicing analysis management functions: run analysis, view and clear analysis results
- Features – contains all the enrichment analysis, FEA and GSEA, management functions: run analysis, view and clear analysis results
Located after the menu buttons, are the data table search text field and the filter checkbox controls. These controls apply to the currently selected data table, in one of the subtabs below, and as their name implies, are used for searching and table row filtering purposes. Finally, all the way on the left, there is a menu button to access miscellaneous application functions.
B. Top (Data) Tab Panel
C. Bottom (Data Visualization) Tab Panel
D. Data Tab
E. Data Visualization Tab
F. Gene Data Visualization Tab
G. Annotation Source Tab
H. Application Tab
I. Subtab
J. Subtab Menu Bar
Tabs and subtabs will be discussed in details in the Tabs section.
Context-Sensitive Menus
In addition to all the visible menu buttons in the application, there are context-sensitive menus all over the application that are not visible. Context-sensitive menus are popup menus that are only shown as a result of a right-click with the mouse on a user interface display element. The menu item selections shown, and/or the actual data displayed when a selection is made, will vary based on what display element, or even what part of it, was right-clicked. For example, gene data visualization is accessed via context menus, what gene the data visualization is shown for depends on what row of the data table the right-click took place on, see image below. The same row specific context display applies to drill down data displays.
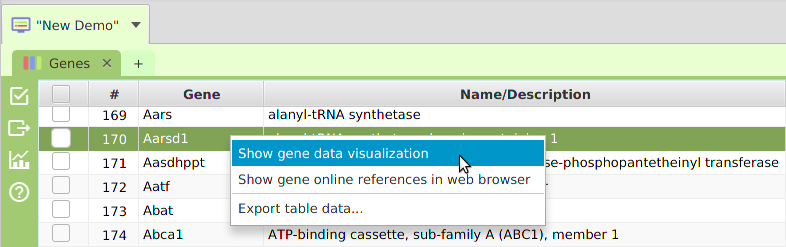
Gene Context-Sensitive Menu
Application functionality can sometimes be accessed more efficiently via context menus. For example, if you have multiple display elements on a data visualization subtab, you may right-click on the display element you are interested in and the export menu selection shown in the context menu will be exclusively for that element. The gene data visualization and drill down data, previously mentioned, are examples of functionality that is only accessible via context menus. Make sure to not miss out on application functionality accessible only in context menus: when in doubt, right-click and see what pops up.
Tab Panels, Tabs, and Subtabs
All application information display is organized into tab panels, tabs, and subtabs. The tabs, depending on their type, are displayed by default in either the top or bottom tab panels, see Application GUI Layout image. However, before we proceed, let’s review the terminology:
- Tab panel – refers to a display control that contains tabs
- Tab – refers to a display control, contained in a tab panel, that contains subtabs
- Subtab – refers to a display control, contained in a tab, where the actual information display takes place, i.e. tables, charts, etc.
And the display hierarchy is:
There are five different types of tabs in the application:
- Project Data Tab (one per project) – contains project data and analysis result subtabs and is displayed on the top tab panel by default
- Project Data Visualization Tab (one per project) – contains project data visualization subtabs and is displayed on the bottom tab panel by default
- Gene Data Visualization Tab (one per gene, project specific) – contains all gene data visualization subtabs, see Gene Data Visualization section for details, and is displayed on the bottom tab panel by default
- Annotation Source tab (one per project) – contains annotation features details and data visualization subtabs for selected annotation source and is displayed on the bottom tab panel by default
- Application Tab (one per application) – contains global application information subtabs such as the log, overview, technical information, etc. It is displayed on the bottom tab panel by default
The gene data visualization tab and the application tab display a relatively small number of subtabs. However, the project data and data visualization tabs can display a significant number of subtabs for all the data, analysis results, and corresponding data visualization. It will be up to you to explore the application and see all that’s available.
Subtabs Menu Bar
A significant amount of your interaction with the application will take place via the subtabs menu bar, see Application GUI Layout image. It contains a set of menu buttons to provide the functionality required based on the subtab contents. You can take advantage of the mouseover functionality available for all buttons, to find out what it does, or just click on it to find out. The application will always confirm your request before doing anything destructive so have no fear. Once you can associate the button images with their functionality, the application becomes easier to use. The subtab menu bar buttons along with their respective functionality are:
|
|
– miscellaneous options menu will change based on subtab content |
|
|
– table row selection management menu |
|
|
– export data or images menu |
|
|
– data visualization menu |
|
|
– clustering analysis menu |
|
|
– rerun analysis |
|
|
– change analysis significance level |
|
|
– show subtab help |
|
|
– zoom control buttons |
Tables
All application tables use a standard GUI so you should be familiar with basic functionality like scrolling, resizing columns, etc. There are some features you may not be familiar with:
- Column sorting – if you click on a column header (where the column name is displayed) you can sort the table rows based on the contents of that column. If you click on the same column header multiple times you go through a cycle: ascending sort, descending sort, and clear sort. You may also sort by multiple columns. To do that, you click on the first column you want to sort by and then you hold the shift key and click on the next column you want to sort by. An example would be to sort by the DSA Results column in the DSA results table and then shift-click on the Q-Value column to see them in order.
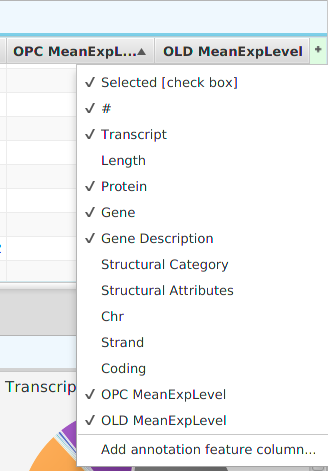
- Show/hide columns – if you look at the top right corner of the table, you will see a small plus sign on a green background. If you click on it, a drop down menu will appear, see table image below. Each column will be displayed as a menu selection and the columns currently shown will have a check mark by them while the ones that are not shown will not. You may toggle the show/hide status by clicking on the column menu selection. If applicable, depends on the table, you may also add special annotation feature columns, on a need to basis, using the “Add annotation feature column…” menu selection at the bottom. You should only add annotation feature columns if you intend to use them for filtering. If you add the feature name/description column, be aware that some annotation features have long descriptions, such as GO terms, and can use up a considerable amount of memory.
You may export the table data to file via the export menu button on the subtab bar or via the table’s context menu. Table search and row selection functionality is covered in the Ad Hoc Query section.
Visual Display Controls
Most visual display controls – charts, graphs, etc. – in the application provide some interactive functionality:
- Mouseover – if you hover the mouse pointer over some areas, additional information will be displayed in the form of a tooltip. For example, if you hover the pointer over a pie chart section, it will normally display the section name and count/percentage information
- If you right-click on the control, a context menu will popup and provide an export image menu selection
There are some special visual display controls that provide additional functionality for customizing or interacting with the display:
Annotation features visualization controls
In the Gene Data Visualization tab, there are 3 special annotation features visualization controls in the transcript, protein, and genomic subtabs. In addition to providing the basic functionality previously mentioned, they also support:
The Options button in the Subtab Menu Bar section provides multiple options to customize the display and filter the data shown:
- Show gene isoforms aligned or unaligned
- Show/hide splice junctions (only if aligned)
- Show/hide PROVEAN score (proteins only)
- Show/hide ruler
- Show/hide display of structural attributes
- Sort isoforms by various methods
- Show only varying annotation features (varying among isoforms)
- Filter annotation features displayed
Note: some options are not applicable to all 3 subtabs and will not be available in all menus
Horizontal Zoom
If you double-click on the display, it will zoom in. If you hold the shift key down and double-click on the display, it will zoom out. Given the nature of the display contents, zooming only affects the horizontal axis. The same functionality is provided in the subtab bar using the zoom buttons, see Subtab Menu Bar section.
Network clusters and GO terms graph controls
The network clusters graph, and the GO term directed acyclic graph, support zooming in/out by clicking and also support panning:
If you double-click on the display, it will zoom in. If you hold the shift key down and double-click on the display, it will zoom out. You may also use the mouse scroll wheel to zoom in and out.Pan
Panning refers to ‘dragging’ the display area around with the mouse. It is typically done by pressing the left mouse button button down, on an empty area of the display, and keeping it down while moving the mouse around to ‘drag’ the display area.