tappAS
tappAS: Your application to understand the functional implications of alternative splicing
Features
Projects
tappAS is project based: You create a project, input your data, and then work with it.
Data Analysis
Once you’ve created a project, tappAS provides a large selection of tools to help you analyse your data.
Data Visualization
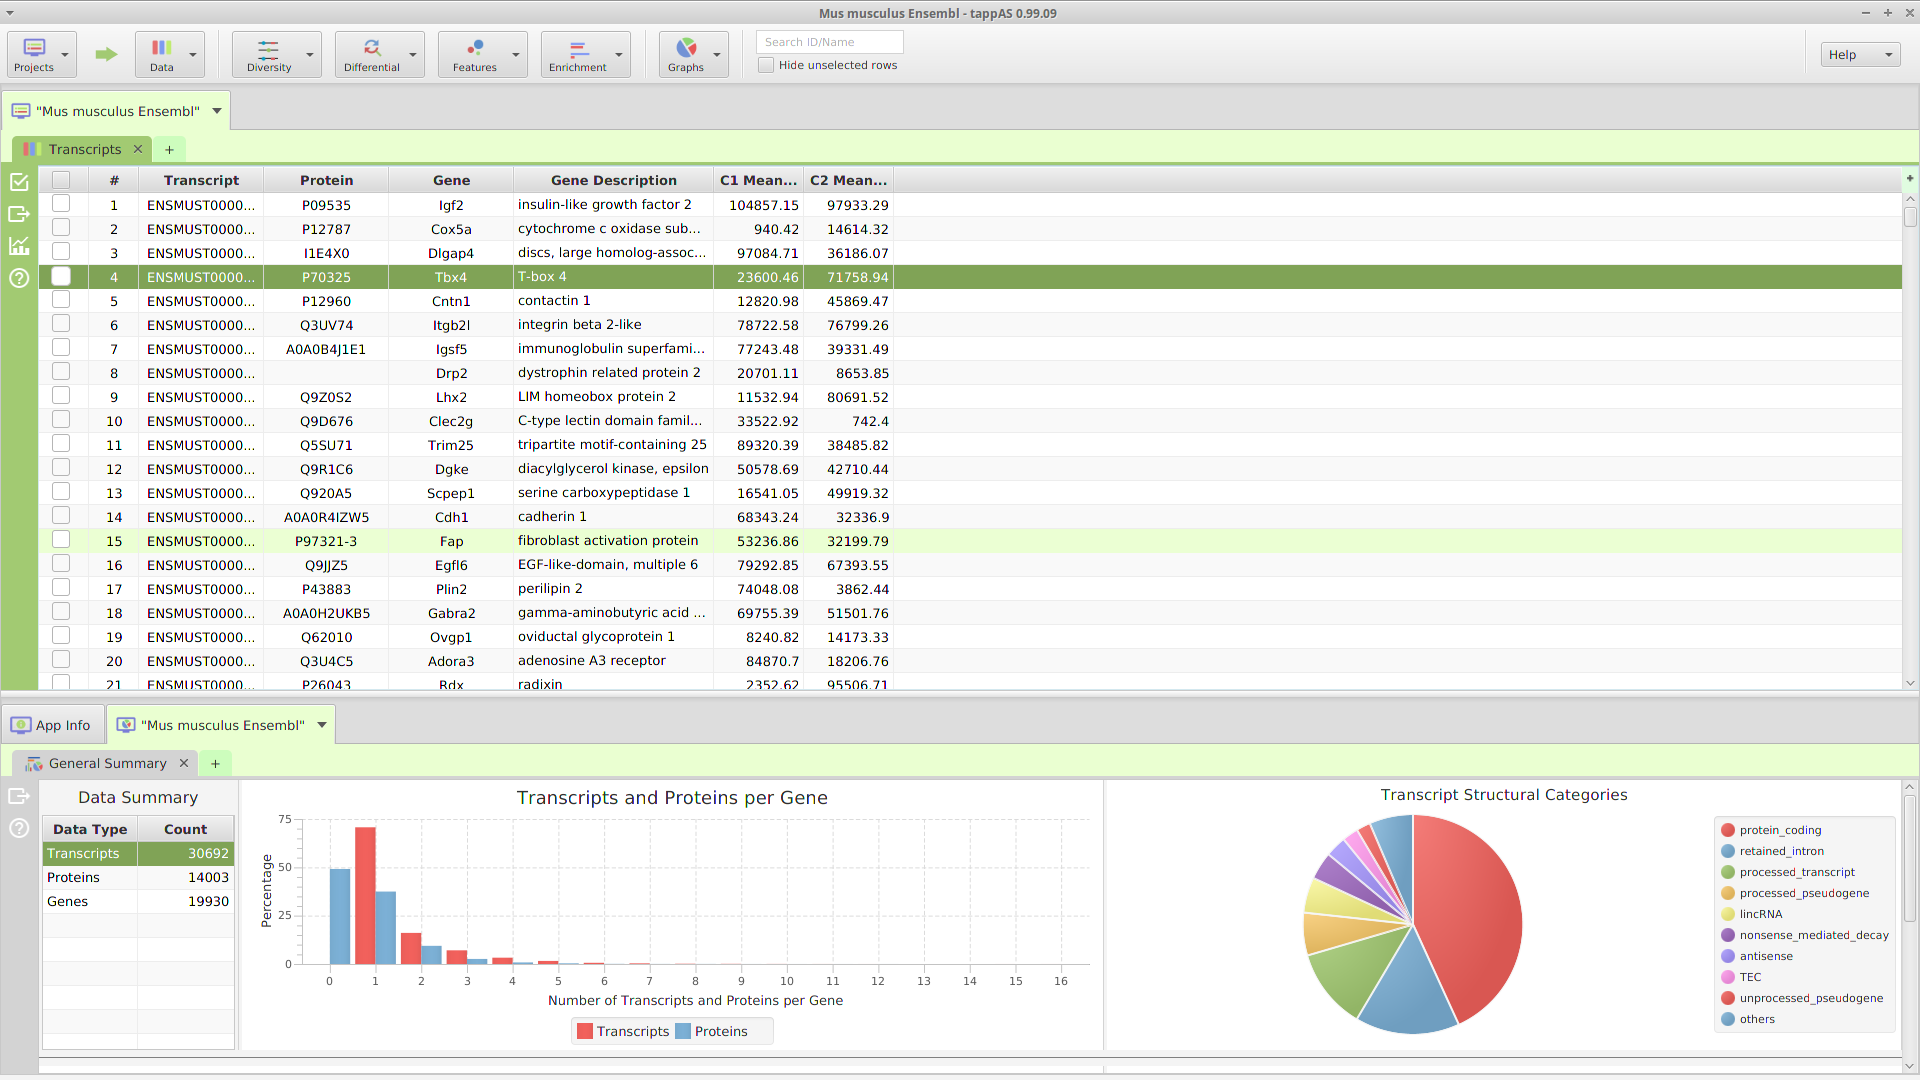
tappAS provides a comprehensive set of data visualization tools to help you recognize patterns and better understand the data.

What is tappAS?
-tappAS will run on most modern computers, provided they have enough computational resources and storage.
-Best of all, tappAS is FREE for non-commercial use.
Projects
-tappAS is project based: You create a project, input your data, and then work with it
-You need three files to create a project: an experimental design file, a transcript level expression, matrix and the corresponding annotation file
-tappAS provides annotation files for multiple species. You may use one of them or provide your own
-Data normalization and filtering options for expression levels and transcripts are provided


Species
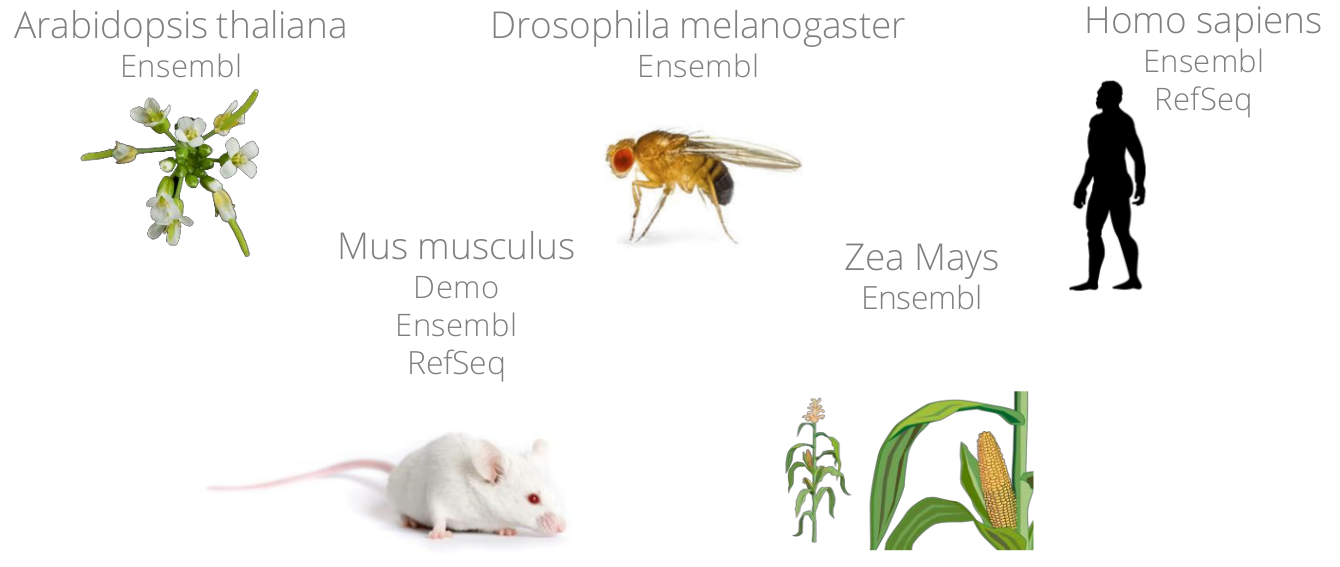
tappAS has annotation files for five different species. If your specie is not here don’t hesitate to contact us clicking here and request it. We will include as soon as we can.
Data Analysis
Once you’ve created a project, tappAS provides a large selection of tools to help you analyse your data:
-Differential Splicing Analysis (DSA)
-Annotation Features Differential Splicing Analysis (FDSA)
-Differential PolyadenylationSite (DPA)
-Annotation Features Diversity Analysis
-Differential Expression Analysis (DEA)
-Gene Set Enrichment Analysis (GSEA)
-Functional Enrichment Analysis (FEA) including Clustering Analysis.
Data analysis is provided for case-control and single or multiple time-course experiments. Alternative splicing information is important for understanding RNA-Seq data: in addition to gene level data analysis, tappAS tools provide data analysis at the isoform level.


Data Visualization
tappAS provides a comprehensive set of data visualization tools to help you recognize patters and better understand the data:
-Summary plots and charts.
-Distribution charts.
-Annotation features visualization for genes, transcripts, and proteins.
-Expression data density and PCA plots.
-Cluster network graph.
-GO terms directed acyclic graphs.
-Venn Diagrams.
-Miscellaneous data visualization.
Other Features
Using JavaFX as its platform, TAPPAS provides the rich set of features expected from a modern GUI application:
-Data tables with customizable columns, sorting, and filtering.
-Ability to export all application data and images to file.
-Resizable windows and zooming.
-Context-sensitive help and menus.
-Data drill downs.
-Display customization.
-Individual projects tabs.
-And lots of other features…

Requirements and Installation
What you need to have:
-A computer with up-to-date GUI version of Linux or Unix, Mac or Windows
-Minimum of 8GB of memory and 4 CPU cores
-Adequate amount 20GB or more, of unused disk space
-An up-to-date version of R along with a few statistical packages
What you need to do:
1. Download the appropriate file for your OS and extract it to get started
2. To run the application in:
Linux: Double click in dist/linux/tappas/bin/tappas
Windows: Double click in win/tappas/tappas.exe
macOS: Double click in dist/macos/tappas-1.0.dmg