Annotation Feature Analysis
The analysis of annotation features provides…
Note: Will include content from the research paper, once it becomes available
Annotation Features Diversity Analysis (FDA)
The diversity of annotation features among gene isoforms…
Note: Will include content from the research paper, once it becomes available
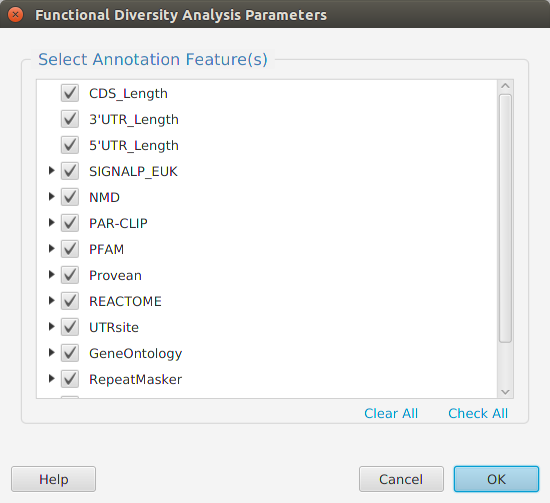
When using the application, all FDA parameters are described in the Help page which can be accessed via the Help button located on the bottom left of the dialog window.
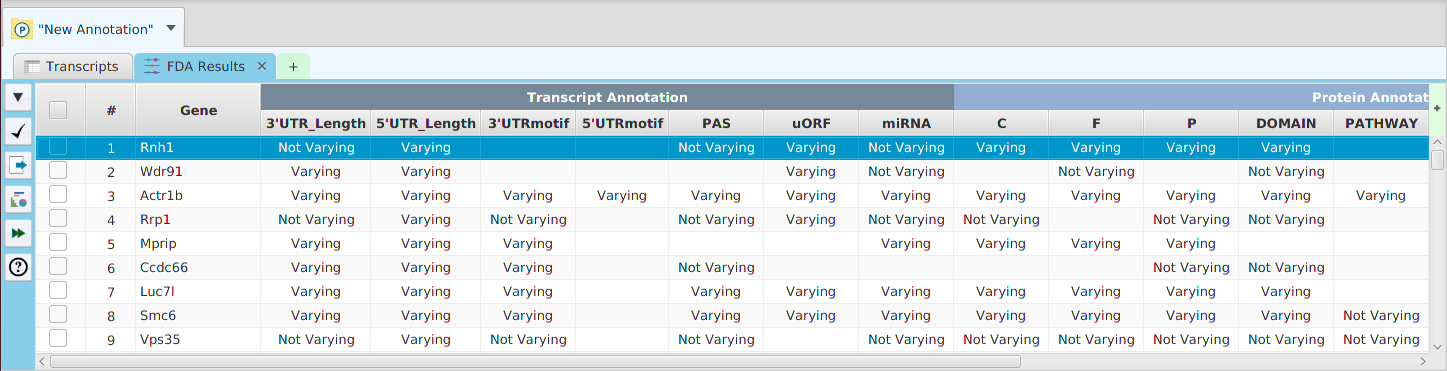
FDA Results
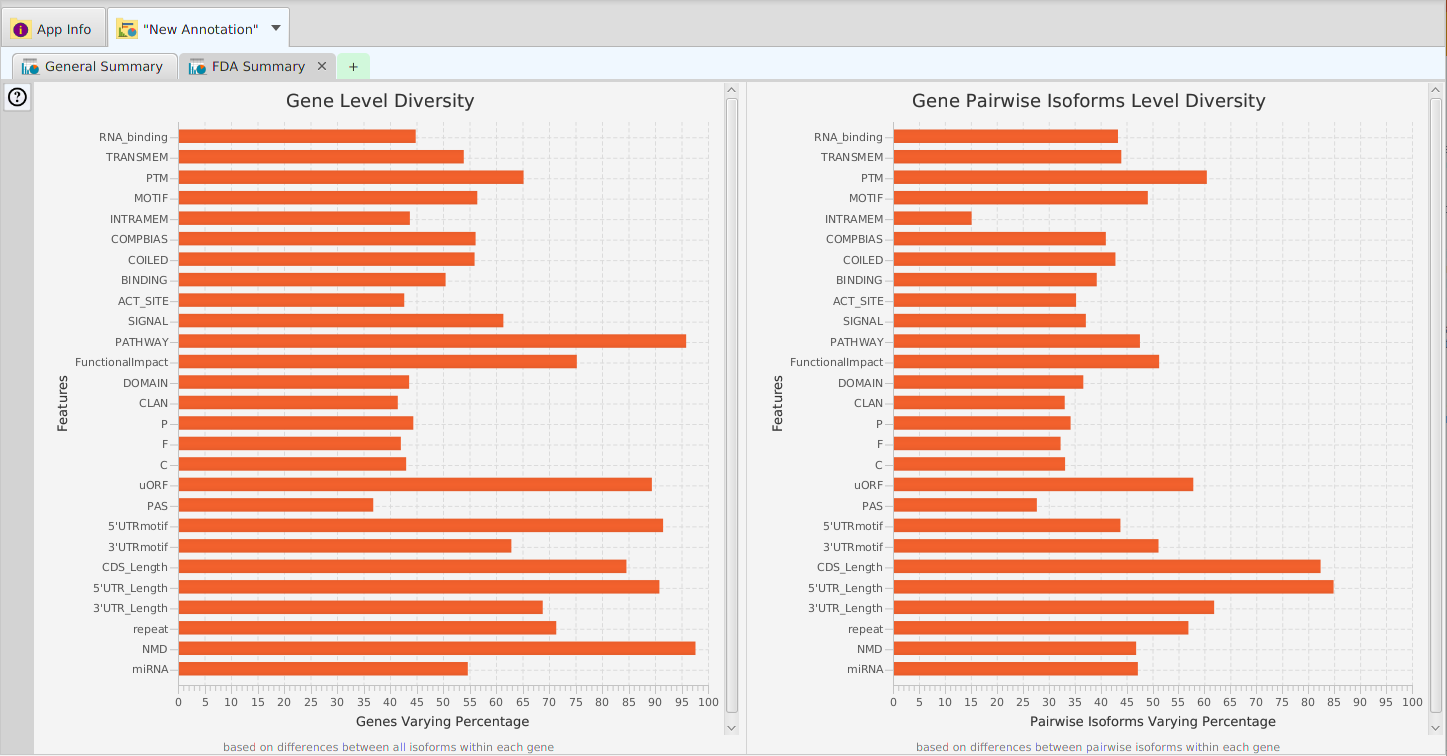
FDA Results Summary
Differential Feature Inclusion Analysis (DFI)
To perform Feature-level differential splicing analysis, you choose what features you will like to include. You also need to specify if you want the features among gene isoforms to be compared using presence or genomic position overlap. The former just checks for the feature being present and having the same count. The latter checks for a genomic position overlap match for each instance of the feature. Just like in regular DIU, you may choose which R package to use, DEXSeq or edgeR.
Note: Will include content from the research paper, once it becomes available
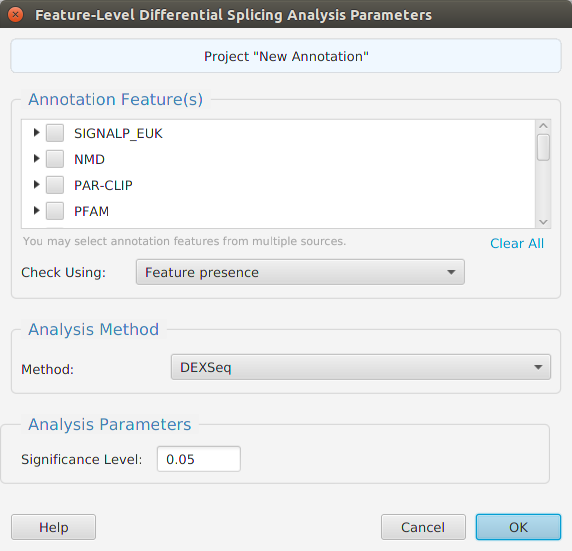
When using the application, all DFI parameters are described in the Help page which can be accessed via the Help button located on the bottom left of the dialog window.
DEXSeq
edgeR
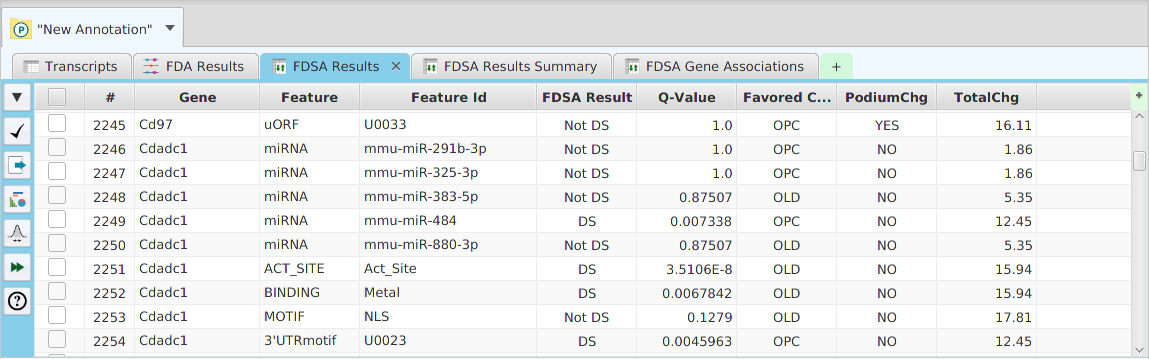
DFI Results
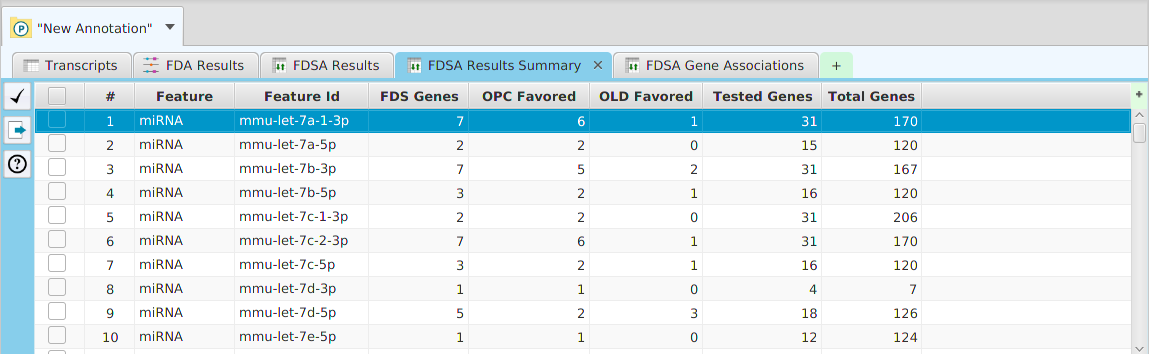
DFI Results Summary
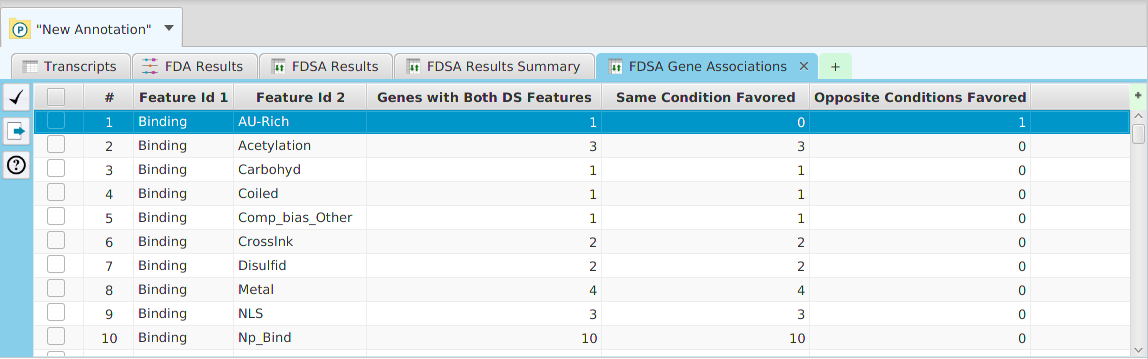
DFI Results Gene Association