Data Visualization
Data visualization is a powerful tool for recognizing patterns, detecting correlations, and better understanding the data. TAPPAS provides a diverse set of visual elements for this purpose:
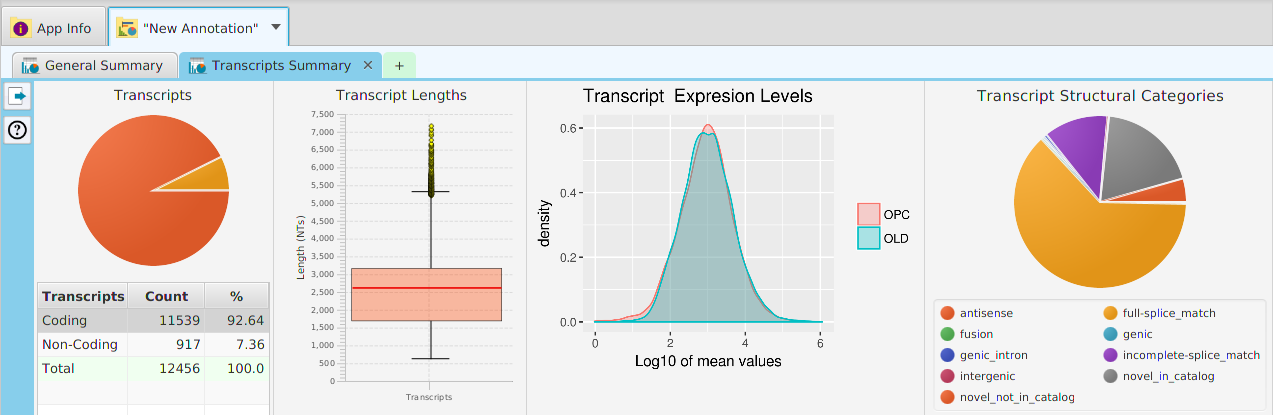
- Summary graphs, charts, and plots
- Distribution charts
- Annotation features visualization graphs for gene, proteins, and transcripts
- Expression level data density and PCA plot
- Cluster network graphs
- GO terms directed acyclic graphs
- Venn diagrams
- Other miscellaneous visualization displays
Accessing Data Visualizations
Data visualization display subtabs are provided for most data tables in the application. The easiest way to access data visualization for a specific table is to click on the data visualization button provided in the data subtabs and then choose from one of the menu item selections, see image below. Alternatively, you may use the Graphs menu button on the application’s top tool bar and select accordingly.
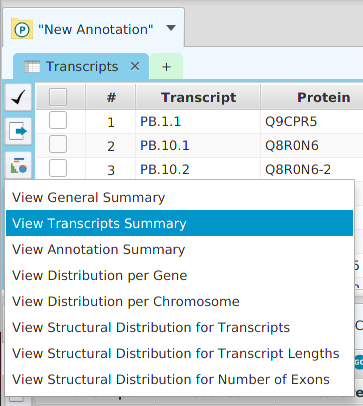
Once you make a selection, the data visualization subtab will be shown in the project’s data visualization tab, see image below.
Gene Data Visualization
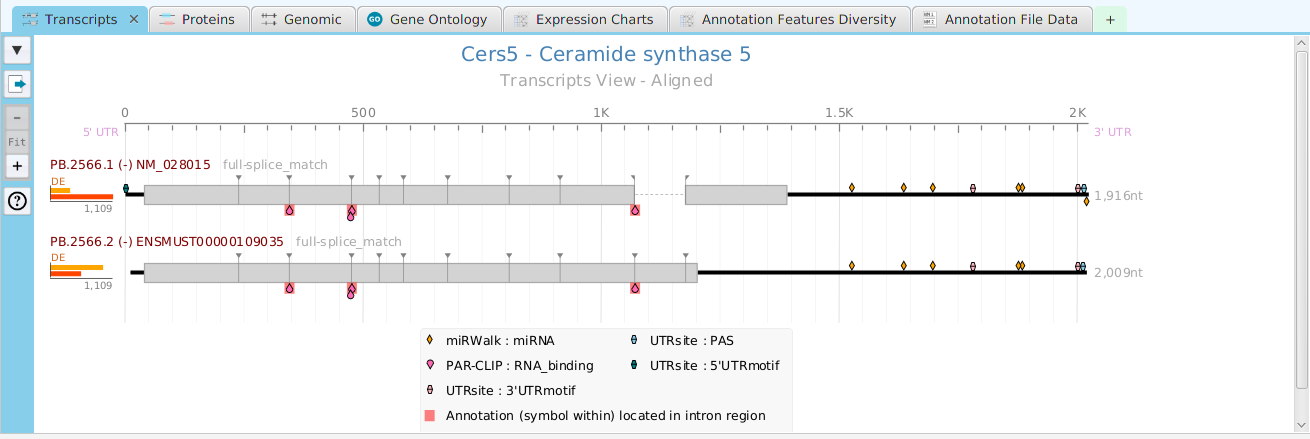
tappAS provides a self contained display tab for gene data visualization. It includes a comprehensive set of data visualization subtabs for gene annotation features down to the individual isoforms. The following subtabs are included:
- Transcripts – display of transcript annotation features
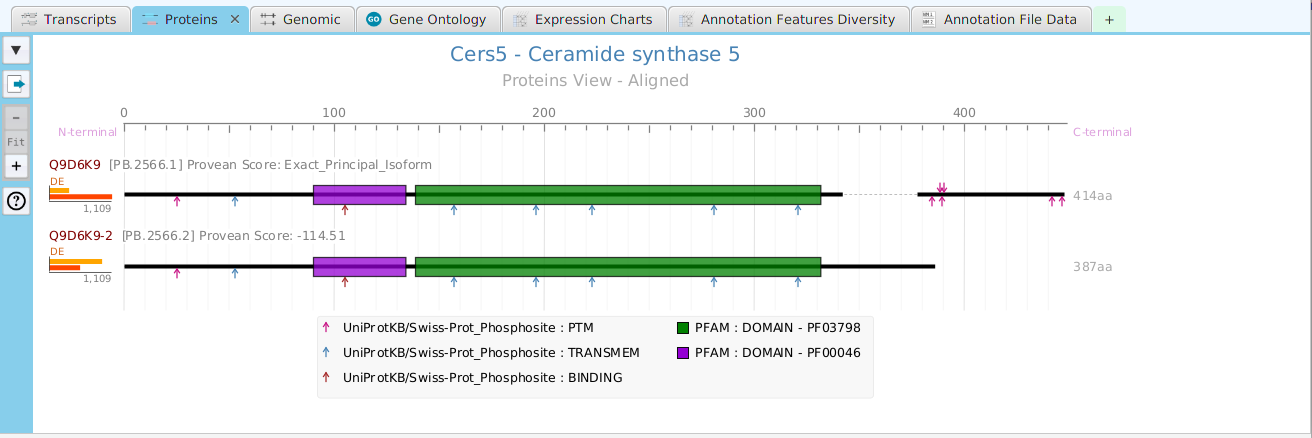
- Proteins – display of protein annotation features
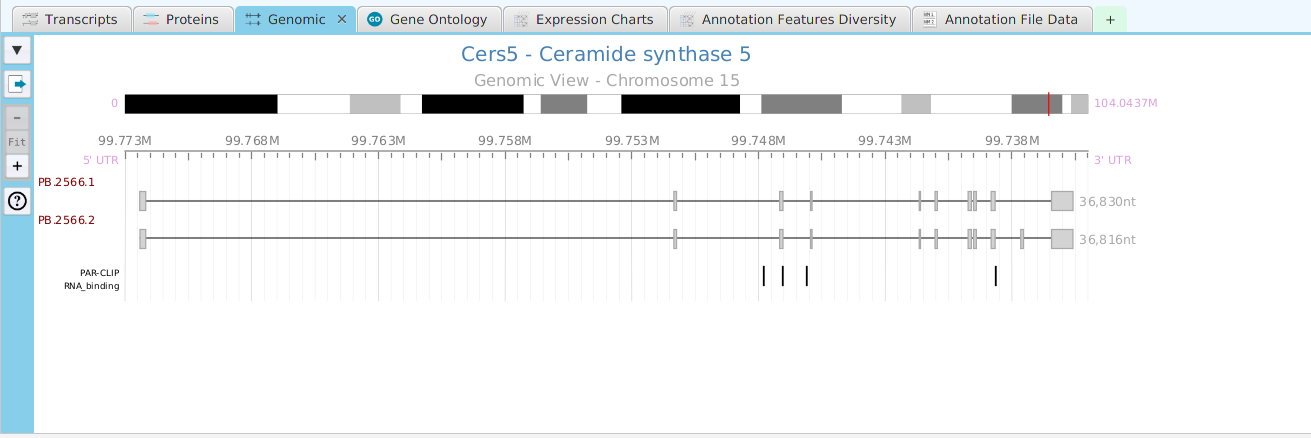
- Genomics – full genomic view showing exons, introns, and genomic annotation features
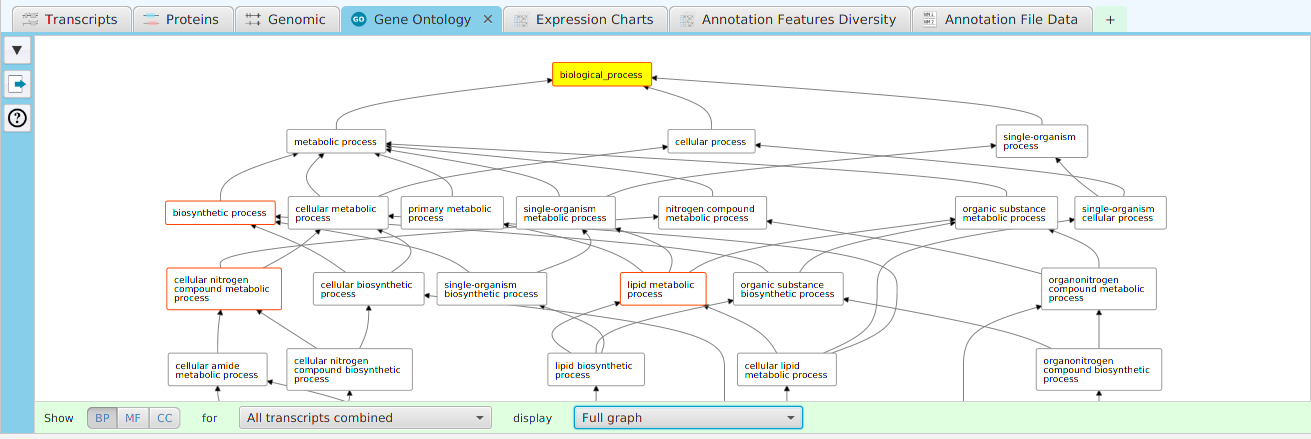
- Gene Ontology – display of gene ontology graph for GO annotation features
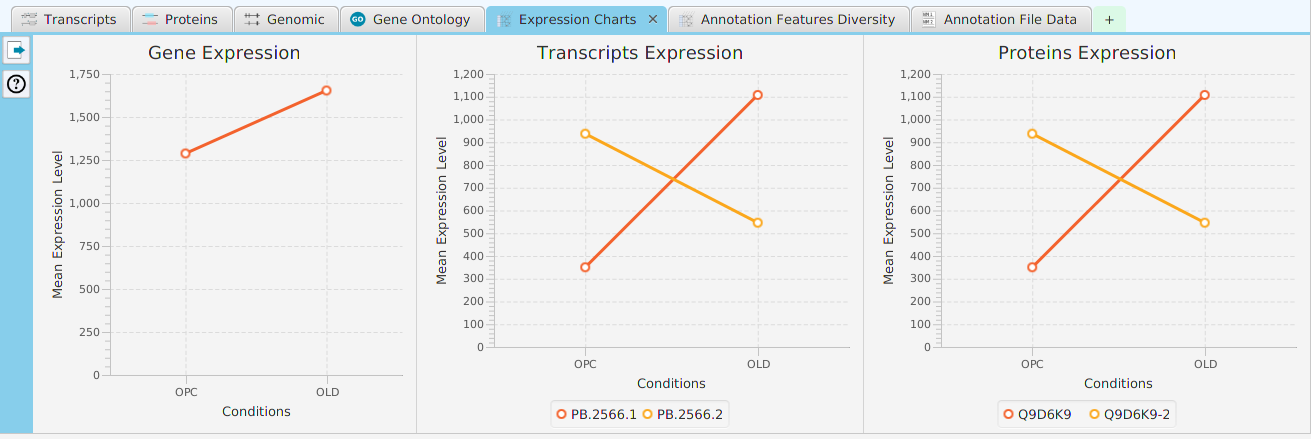
- Expression Charts – display of expression level charts for gene, proteins, and transcripts
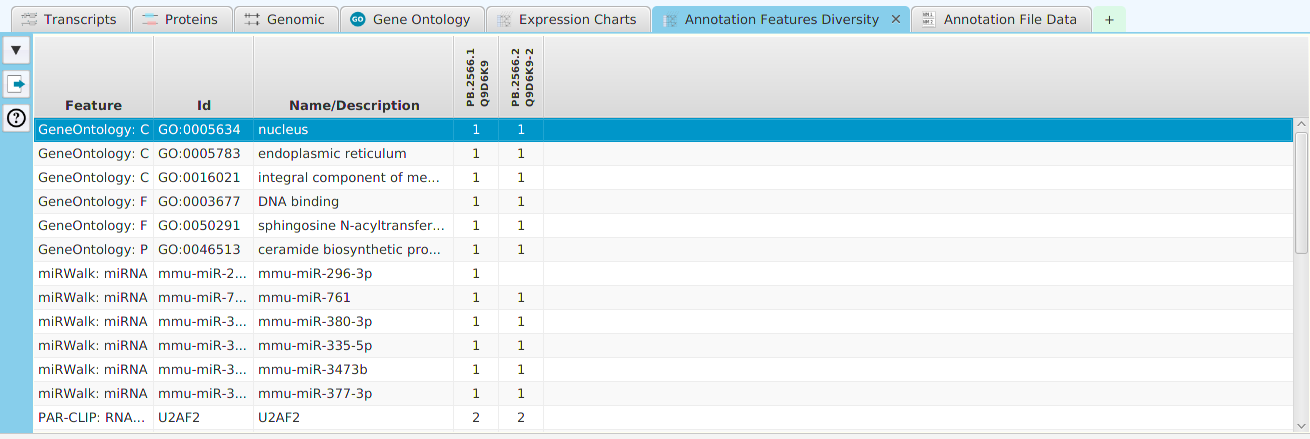
- Annotation Features Diversity – cross table display of annotation features and transcripts/proteins
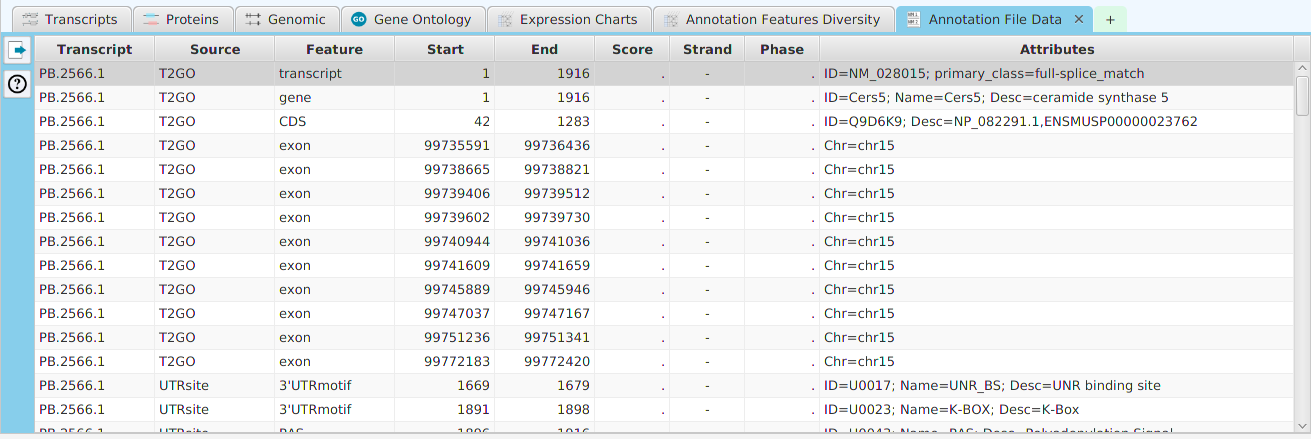
- Annotation File Data – display of all annotation features for this gene contained in the annotation file
To access the visualization data for a specific gene, right click on the table row containing the gene of interest, for example the gene data table or the DIU results table, and click on the ‘Show gene data visualization’ menu item selection in the context menu. See Context-Sensitive Menus section. You may use the slide control buttons below to see all gene data visualization subtabs snapshots.